Despite Italy investing so little in research, Italian researches are holding on, at least if we consider the number of cited publications at international level. What is critical, however, is the following step: from research to industrial applications, as shown from patents, start-ups and other indicators statistics. Yet, it is the combination of research, innovation, industrial dynamism and capability of winning new markets that can really “re-start” our Country, recovering employment and withstanding the more and more intense international competition.
On the basis of the new OECD 2013 report – Science, Technology and Industry Scoreboard 2013 (OECD Publishing) – we tried to draw a picture of the Italian situation within these fields, compared to other OECD countries. Here are the most significant data.
Too little investment in Research and Development
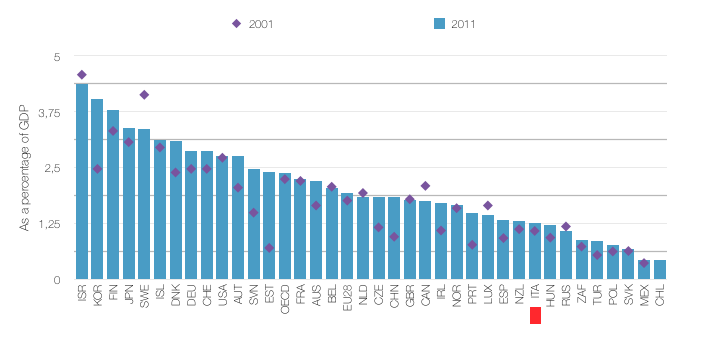
Even though, since 2010, some European countries have tried to counterbalance the crisis by investing in Research and Development, Italy invests (public plus private) only 1.25% of the GDP (2011 data), which is more than 1.08% invested in 2001, but still too little in absolute terms if compared with those countries that really decided to support research. From 2001 to 2011, as observed by OCSE, the area has registered an average increase of R&D investments (from 2.2 to 2.4% of the GDP) with sharp increases in Korea, Slovenia and Portugal as anti-crisis measures, but also decrease in Sweden and Canada (where investments are anyway higher than 2% of the GDP).
Figure 2.1.2 Gross domestic expenditure on R&D, 2001 and 2011
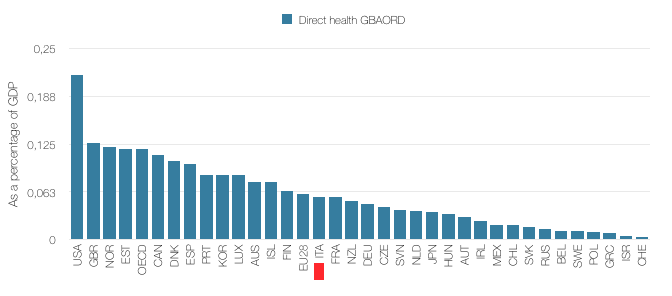
Regarding the public investment in socio-health and biomedical research, the Italian government is both under the OCSE average and the European Union average, and does not reach 0.1% of the GDP.
Figure 4.3.1 Government funding of health-related R&D, 2012
Non-scientific mentality and education, if not even anti-scientific
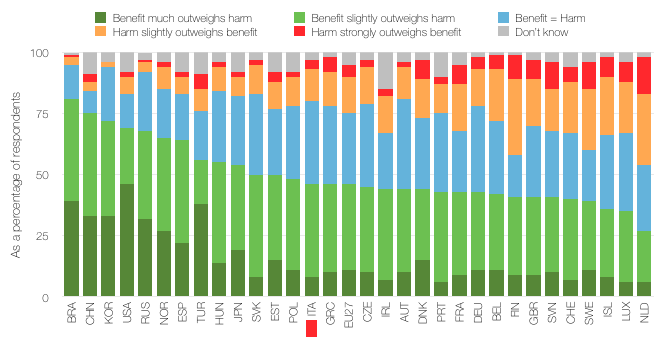
If the economic upturn will need a change in the attitude towards the knowledge-economy, followed by more investment in research, it is vital that public opinion supports this effort. Unfortunately, public perception of scientific research benefits (based on OCSE and UE data) reveal that Europe is permeated by distrust in science, which should not be underestimated. Italy confirms this trend.
Figure 1.68 Public perception of scientific research benefits, 2010
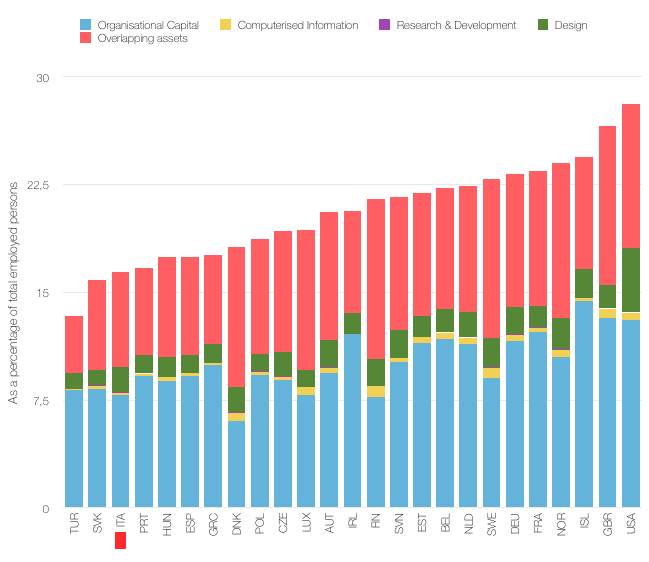
The level of workers’ technological and scientific education is crucial for any country. For this reason OCSE has developed an experimental indicator that measures the knowledge-based capital in relation to education and tasks of industry employees in different countries (researchers, designers, computer technicians and other qualified figures who can make a difference in a firm). Among OCSE countries, 13% is the minimum (Turkey) and 28% is the maximum (US) of added knowledge-based capital related to workers. Italy ranks quite low among the countries.
Figure 2.2.1 Knowledge-based capital related workers, 2012
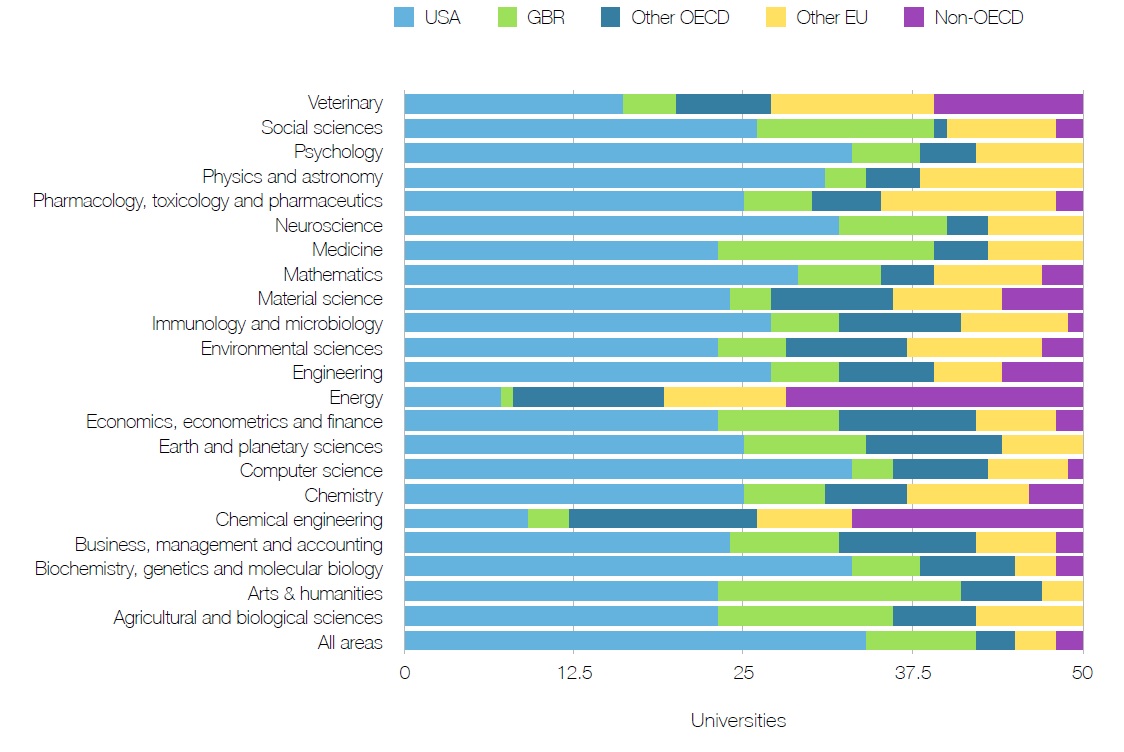
Also considering university education, the hotspots in the scientific field are still concentrated mostly in the United Stated, followed by the United Kingdom and other European countries. Among the best 50 University in all disciplines, 34 are American, 8 British and 3 from other European countries (not Italy), 3 from other OCSE countries and 2 outside the OCSE area. If we consider the best 50 University by discipline, Italy appears only for pharmacology (2), engineer (1) and energy (1).
Figure 1.49 University Hotspot
Research performance: quantity is good, quality can improve
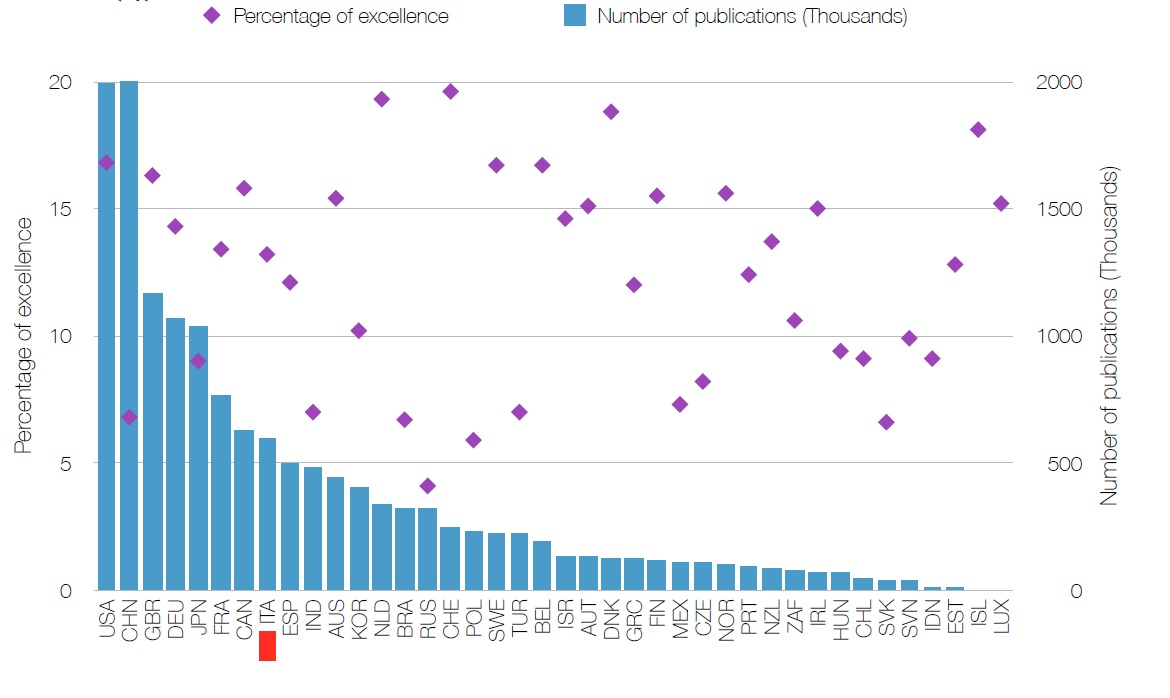
We can assert that Italy, despite the poor investments in research and researchers, manages nevertheless to keep a good position for number of scientific publication at international level, holding the 8th place. However, considering the top-cited publications, Italy has only 13%, whilst 18 countries boast an amount of top-cited researches between 13 and 20%. Despite being productive at scientific level, then, the Italian research system is relatively poorer than others that are based on collaboration among different institutes (both a national and international level).
Figure 3.7.1 The quantity and quality of scientific production, 2003-11 (vedi allegato)
Internationalization means innovation
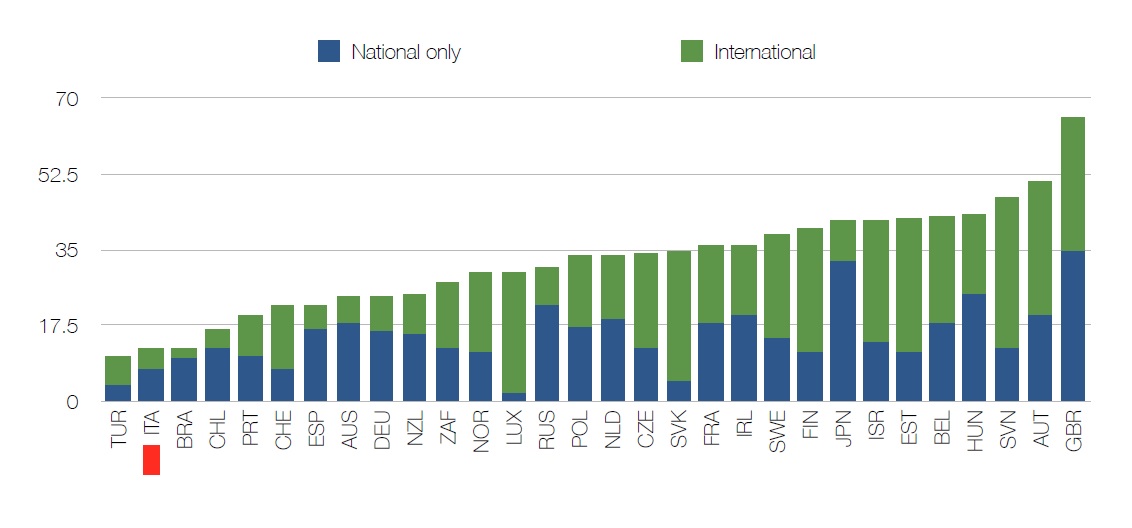
OCSE considers collaboration among firms at a national and, especially, international level an important accelerator of innovative processes. To this regard, Italy suffers for a certain closure of its economy both inside and outside its borders.
Figure 3.4.1 National and international collaboration on innovation by firms, 2008-10
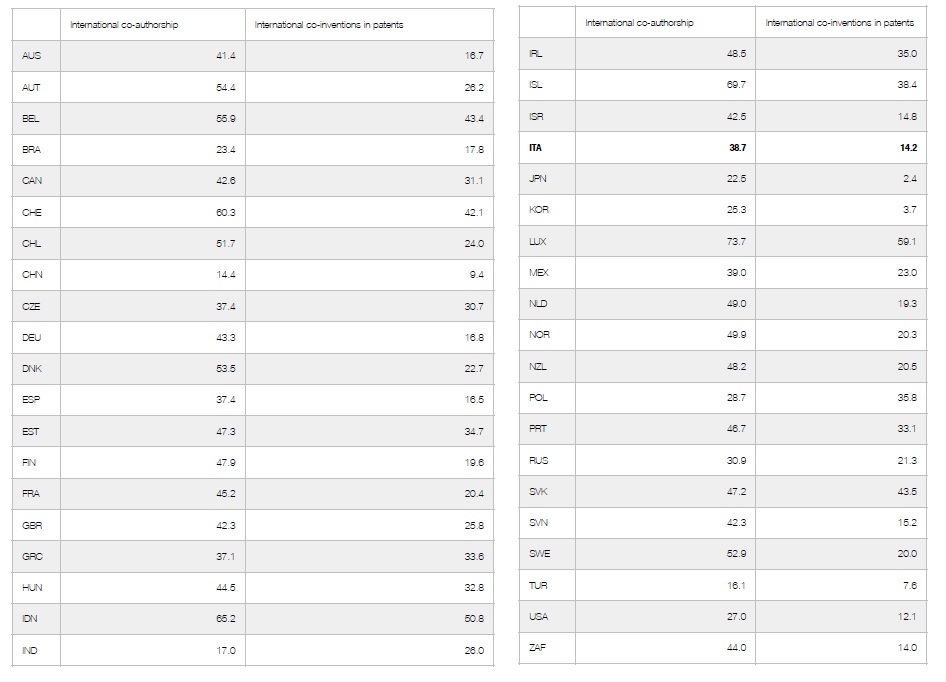
If we compare, than, for every country, how many patents have been developed within international collaborations (co-inventions) and how many scientific researches have been signed also by foreign authors or institutes (co-authorship), it is quite clear that, in Italy, international collaboration is definitely more present in research than in its applications. Actually, except India and Poland, all the countries considered by OCSE are more inclined to co-authorship than co-inventions. Even on this side, however, Italy does not hold a brilliant place, with patent percentage inferior to 20% and less than 40% of articles published by Italian institutions involving foreign researchers, whilst North Europe boasts 50%, Switzerland 60% and Iceland even 70%. Anyway better than United States and Korea (less than 25%) and China (bit more than 15%).
Figure 1.59 International collaboration in science and innovation
Boosting competitive advantage in the trade-market
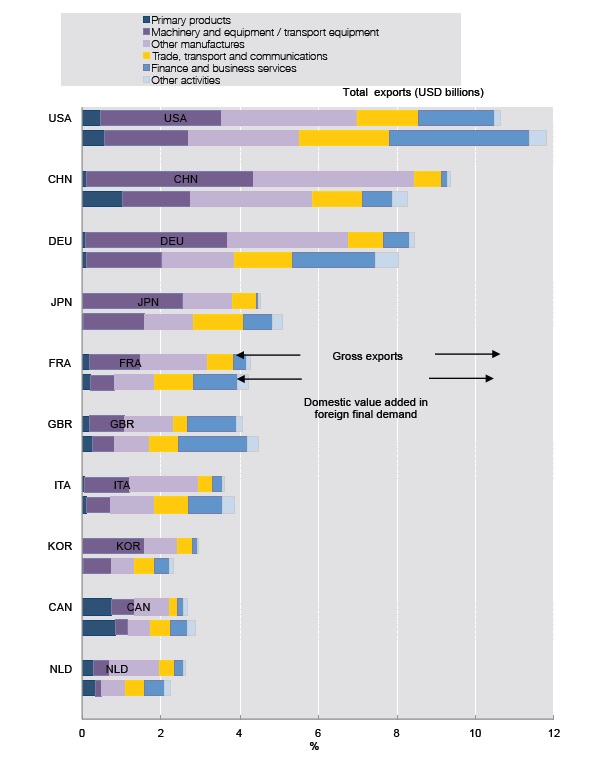
Italy remains nevertheless the second OCSE country for manufacturing exports and the seventh economy for total exports. However, if we consider not the gross data but the "value added trading" (i.e. how much in the goods that consumers buy at a global level is Italian), it is possible to identify the components that really make a country competitive. The figure below shows that France, US, UK and Germany and partly India connect better with foreign demand by means of financial and business services.
Figure 6.6.1 Top ten exporting economies in gross and value added terms, 2009
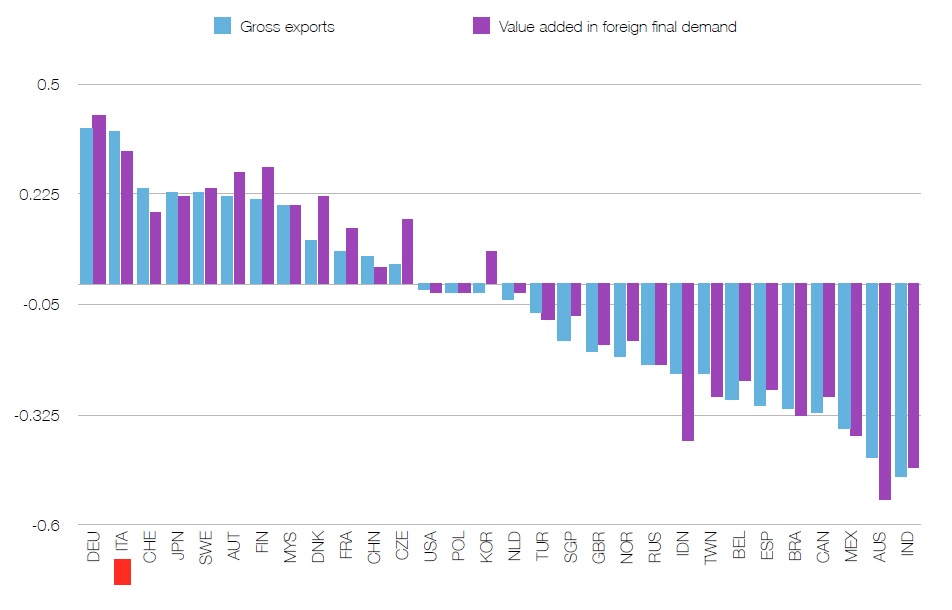
Considering the first 30 manufacturing exporters, Italy confirms its relevant competitive advantage. This advantage, however, could be mined by others who display more added-value types of trading.
Figure 6.6.3 Revealed comparative advantage in exports of machinery and equipment, 2009
Giving credit for re-starting
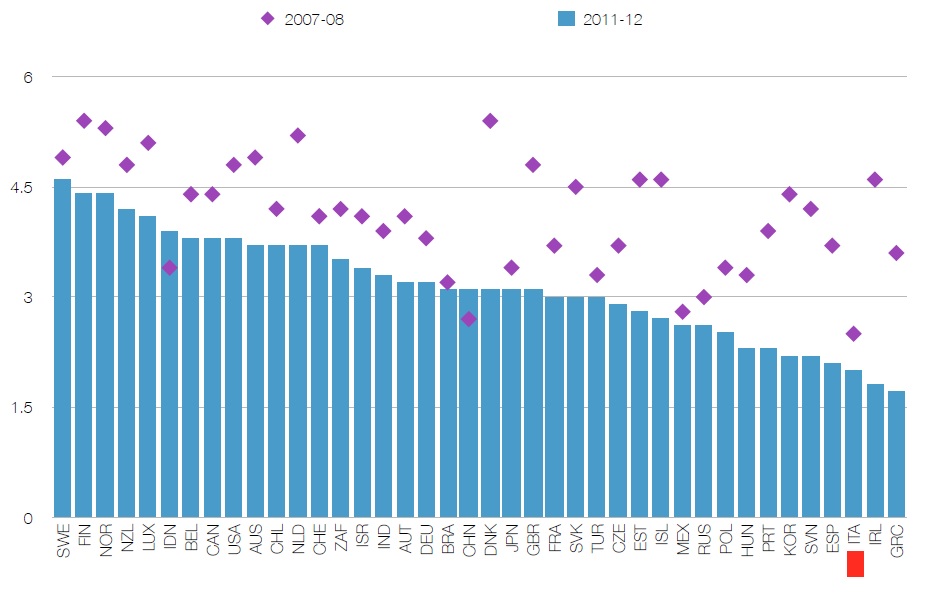
One of the consequences of the financial crisis is the increasing difficulty, for start-ups, to access loans from banks, whilst venture capitals started avoiding risks and now prefer bigger and more stable investments. The decrease in credit access is clear from the table below, which shows how in the last four years only China and Indochina have improved under this aspect. Unfortunately, Italy is third from the last followed only by Ireland and Greece, demonstrating to be a country that does not encourage start-ups.
Figure 5.11.1 Ease of access to loans, 2007-08 and 2011-12
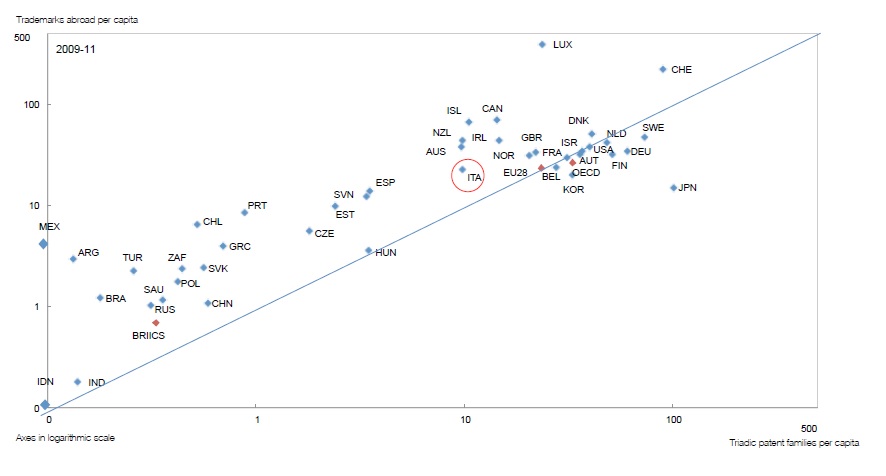
Competing in the new knowledge economy: trademarks and patents
Competing in the system of knowledge-economy also means protecting the products of intellect with patents and trademarks. Using the number of trademarks as indicator of the level of innovation for a country is very convenient because data on applications are public, therefore they continuously provide an updated snapshot of the innovation status of the country. Italy seems to be more inclined to protect trademarks than patents, as it is shown by the number pro capita of these instruments, which once again place our country as the last country among the first ones, i.e. the group including several countries of Northern and Central Europe, US, Canada, Japan, Korea and Australia.
Figure 1.53 Patent and trademark per capita per country
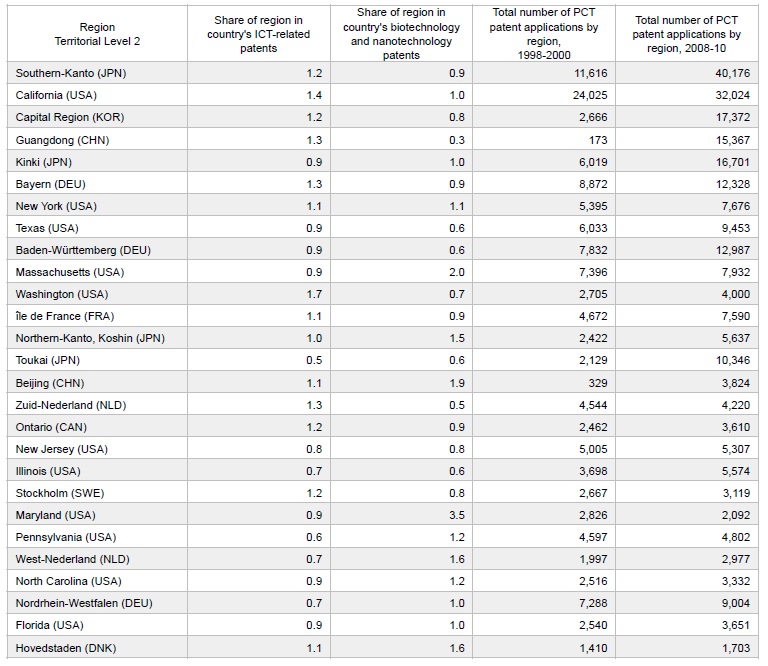
Once again, considering innovation, Italy does not appear among the first 20 regions for number of patents in information technology, biotechnology and nanotechnology, where Japan and US rank very high.
Figure 1.50 Innovation hotspots in ICT, biotechnology and nanotechnologies
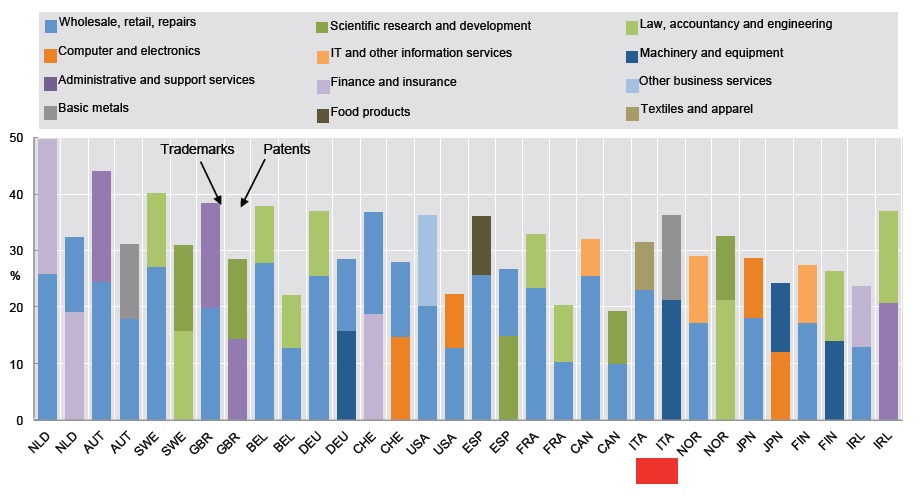
The number of trademarks and patents can also help identifying the most competitive firm sectors of every country. In regards to trademarks, the most important Italian sectors are wholesale, retail, repairs, textile and apparel. The patent percentage in machinery and equipment stands out (a bit more than 20%) as the highest among the analysed countries, as also for basic metals manufacturing.
Figure 5.8.2 Top two industries with trademarks and patents by country, 2009-11
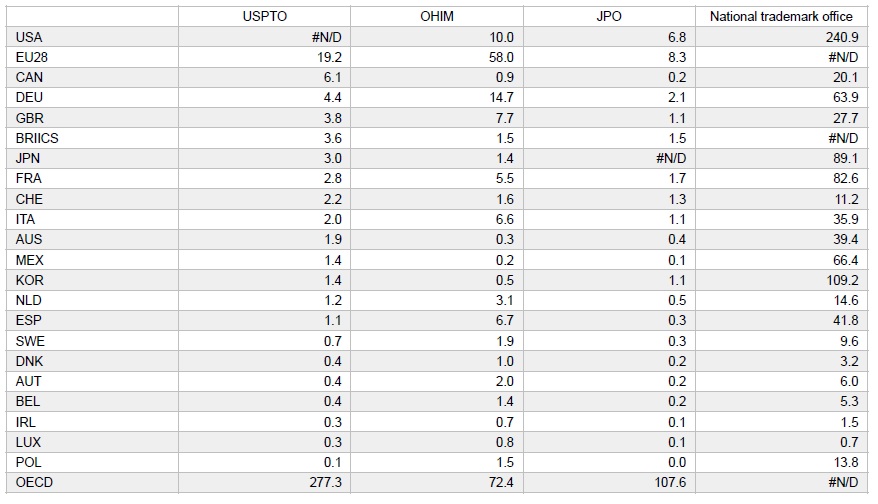
The amount of trademark registration requested to foreign offices or presented from abroad, provide good insight on how firms of a certain country manage to enter foreign markets. From this point of view, Italy is well-placed especially in the European market, thanks to the amount of applications addressed to the European Office for the Harmonization in the Internal Market (OHIM), which is second only to Germany and England, and only slightly inferior to Spain. Also standing out is the capability of Italian brands to aim at the Japanese market: the amount of requests presented to the Japan Patent Office (JPO) compete, in quantity, with the German, English and French ones.
Figure 5.5.1 Top 20 trademark applicants, 2009-11 average
The analysis of patent applications can provide other important information on the economic activities of a country. For example, it is possible to identify the most dynamic sectors in terms of patents; from this point of view, about 50% of Italian patents is represented by high or middle-high technology manufactures, whilst less than 25% is from low technology ones. But one patent alone is not enough. It is then essential to analyses its importance for the future development of a determined technology, evaluating the number and the distribution of citations the patents itself received. Once again, an analysis that places Italy below the European average.
Figure 6.9.1 The relevance of patents for later inventions, 2002-06
Biotechnologies, pharma and health: strategic sectors for Italy
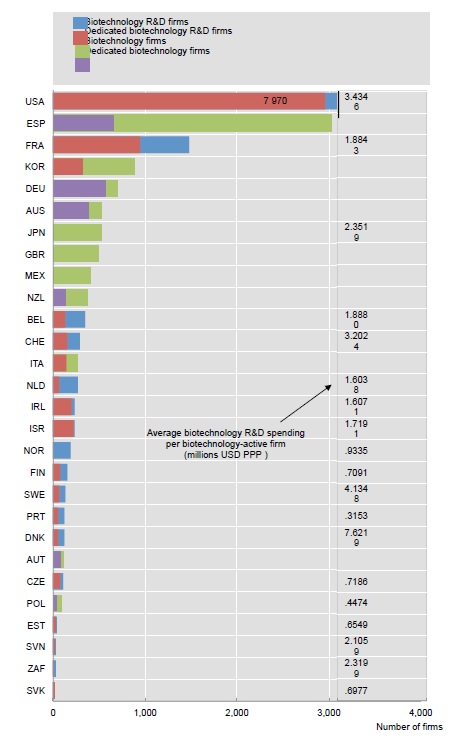
Biotechnology is one of the sectors where it has being invested the most in order to overcome the challenges of global economy. This sector shows great capability of growth and therefore takeover of high-quality competence. Biotechnologies are applied in several firm sectors, such as healthcare, pharmaceutical, textile, chemical, animal healthcare and also food, paper, plastic, fuel and animal feed processing. In 2011, in Italy, 400 firms were active in biotechnology and their sales volume of about 7.15 billion of euro.
Figure 4.4.1 Number of firms active in biotechnology, 2011
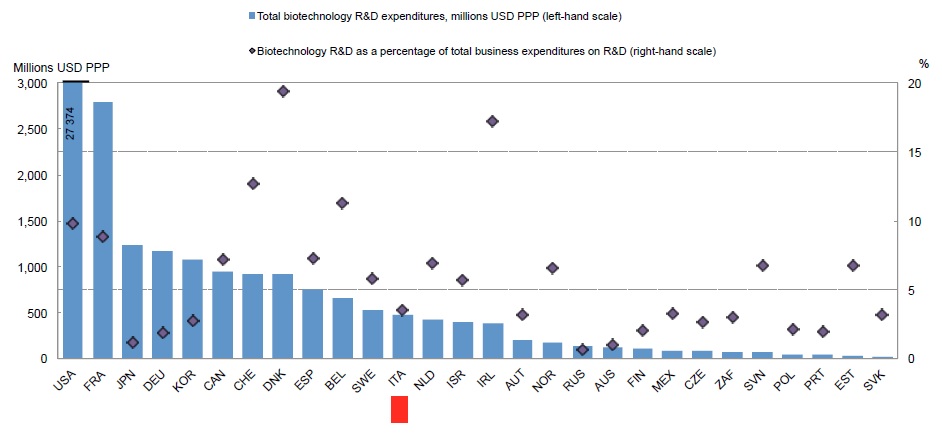
But the number of firms is not the best parameter for understanding the activities of a country in biotechnologies. Data on private investments in Research and Development (BERS) for biotechnologies provide a more direct measure. Italy dedicates 3.6% of the total of private investments to biotechnologies, a much lower percentage respect to other countries, from Spain (7.3%), Denmark (19.4%) or Ireland (17.2%).
Figure 4.4.2 Biotecnology R&D in the business sector
If we consider public investments, in 2011 the Italian government sustained the biotech sector with about 170 million of dollars, which must be compared with 5 billion allocated by Germany. Also Spain (19%) and Korea (14%) have an investment percentage higher than the Italian one (5.12%).
Figure 4.3.3 Biotechnology R&D in the government and higher education sectors, 2011
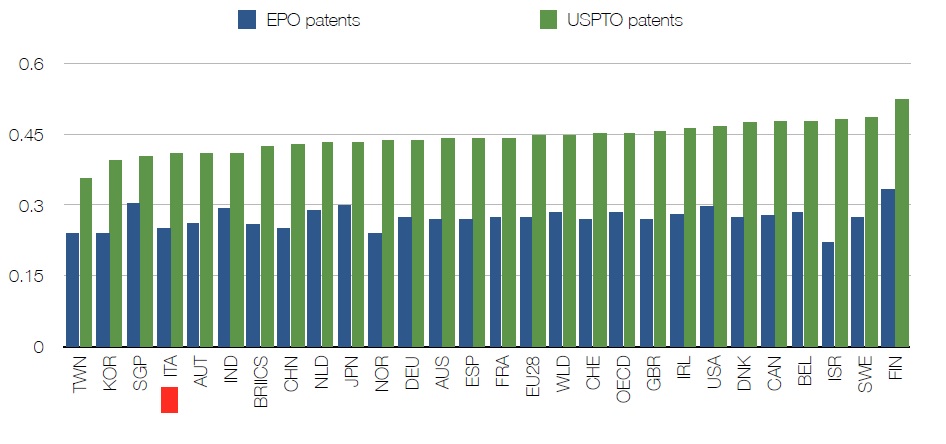
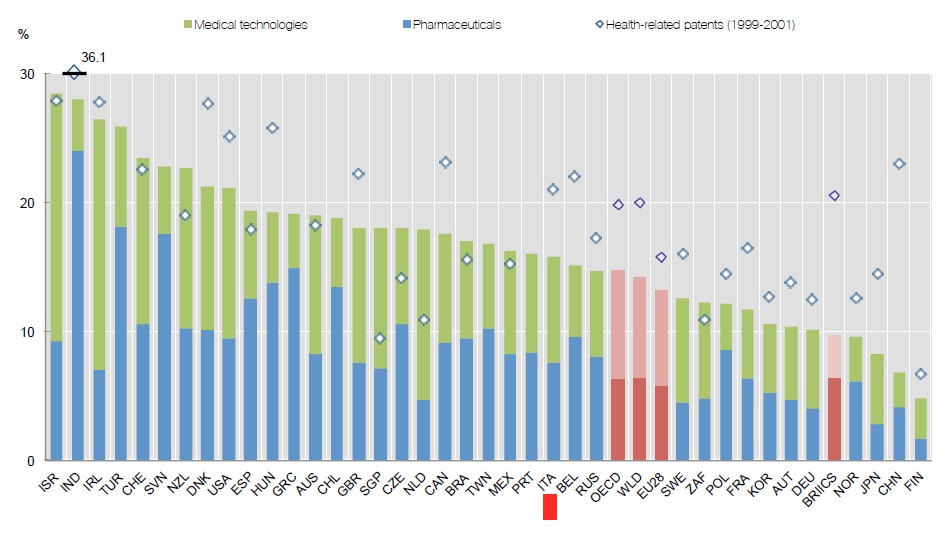
If we examine the years 1999-2001 up to 2011, Italian patents in the health sector represent the 21%, a percentage higher than the average of OCSE countries.
Figure 4.3.2 Health-related patents, 1999-2001 and 2009-2011
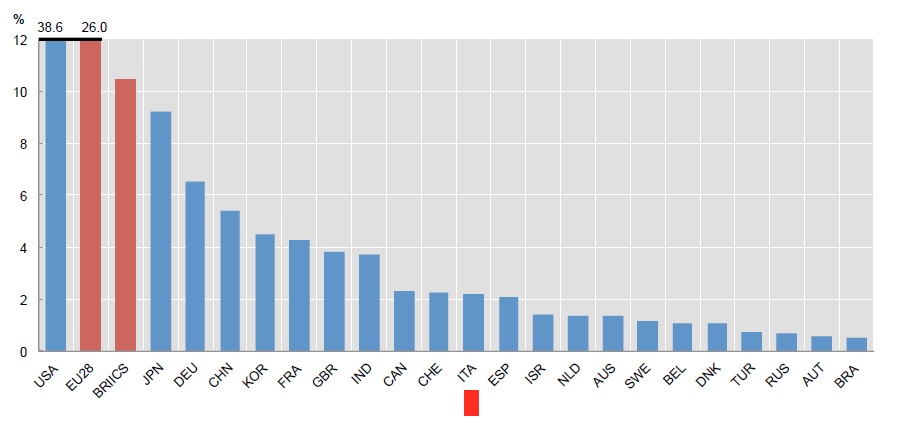
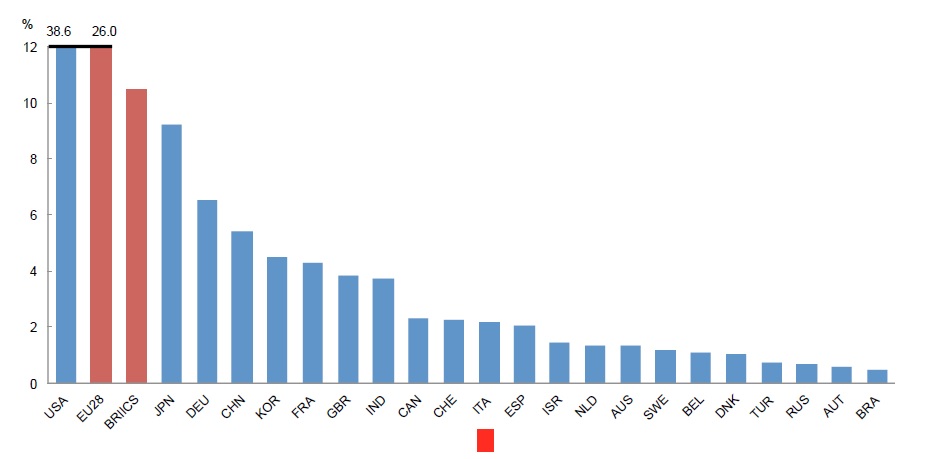
Chemical and pharmaceutical patents essentially regard synthetized molecules, purified natural molecules and recombinant products. Patents by Italian universities and firms in these sectors are 2% of the total; Germany has 6% and France 4%.
Figure 4.3.3 Countries' share in pharmaceutical patents, 2009-11
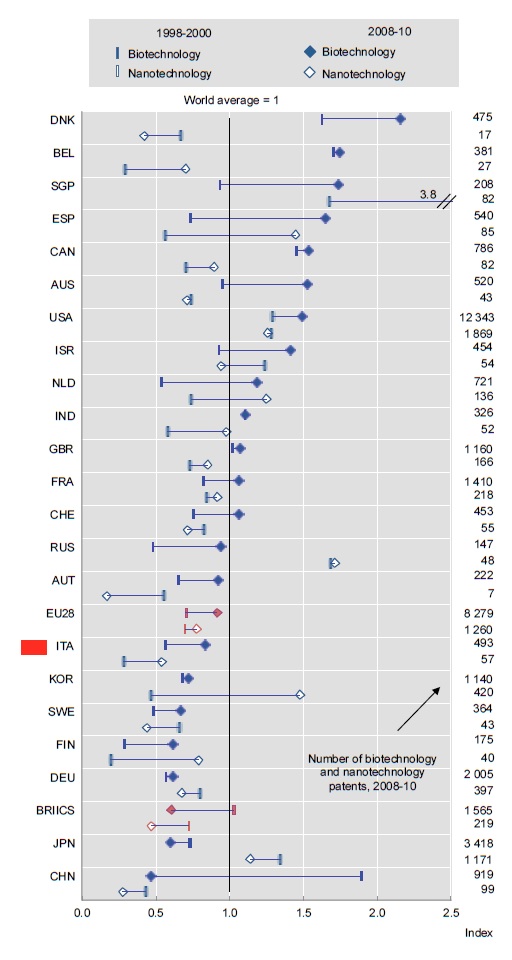
The ability of a certain country’s economy to specialize in biotechnologies and nanotechnologies can be deduced by the RTA index (revealed technological advantage), which is based on patents requests in different technological fields, from 1998-2000 to 2008-2010. Despite a low start, it is encouraging that the RTA index for Italy increased both for biotechnologies, close to the world average, and for nanotechnologies, where however is still behind other countries.
Figure 6.5.1 Change in revealed technological advantage in biotechnology and nanotechnology, 1998-2000 and 2008-10