Vesuvius enters into the history of volcanology with the 79 AD eruption, which was described very accurately in the letter sent to Tacitus by Plinius the Young, who could observe its whole development from Miseno (20 km far from Vesuvius). More recent, qualitative and quantitative (numerical simulations) studies allow to describe deeply the dynamics of sustained and collapsing plinian eruptions, as well as of the pyroclastic currents associated to this kind of eruptions.
Up to now, a great number of studies have been carried out on the 79 AD Vesuvius eruption and many other plinian eruptions occurred in other parts of the Earth. That allowed to describe qualitatively and completely the sustained and collapsing plinian eruptions. These eruptions are characterized by the formation, above the volcanic conduit, of an eruptive column constituted by solid fragments (pyroclasts) dispersed in a turbulent gaseous flow. The column is ejected vertically from the conduit with a velocity between 350 km/h and 1000 km/h, an average internal temperature of about 900° C, and a density greater than that of air (about 1.20 kg/m3). In the right part of Fig. 1, the column collapses in a pyroclastic fountain, from which a pyroclastic current originates upon the impact with the volcanic slopes.
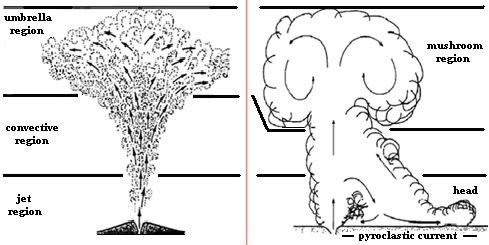
Fig. 1: The two possible evolutions of the pyroclastic column
Left: sustained eruptions; Right: collapsing eruptions
Recently, pyroclastic currents have been described as a turbulent gaseous mixture in which a great number of different pyroclasts are dragged, heterogeneous in space and time, at high temperature (600° C ¸ 800° C), dissipating energy, and propagating with a velocity between 100 km/h and 300 km/h. In Fig. 2, the horizontal structure of a pyroclastic current is shown. The tail is the thinnest part, where pyroclasts are dragged by a weakly turbulent gaseous flow. The body has a greater thickness: here, the pyroclasts are dragged by a moderately turbulent gaseous flow. The head is the thickest part: here, pyroclasts are dragged by a highly turbulent gaseous formation on the ridge. The head ingests external air which expands becoming more dilute, forming a buoyant plume above the body and tail.

Fig. 2: The horizontal structure of pyroclastic currents
The vertical structure of the pyroclastic current shows two parts (Fig. 3): an upper part where the motion of pyroclasts is turbulent, and a lower part in which their motion is determined by the type and number of collisions among them. While the currents flow along the slopes of the volcano, increasingly more pyroclasts settle from the upper to the lower part (sedimentation). The result of the process is the formation of a bottom layer (Fig. 3) at the basis of the current where the flowing of the pyroclasts is modified depending on their concentration. Above a given concentration, from that layer the deposition occurs through the vertical accretion of pyroclasts in regular sequences having increasing or decreasing diameter.
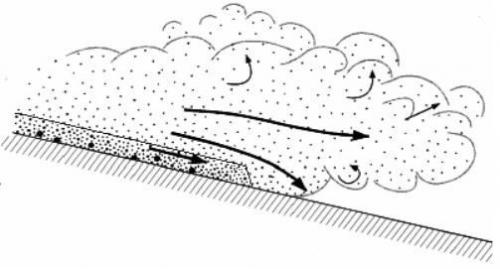
Fig. 3: The formation of the bottom layer at the base of the pyroclastic currents
Because of the high temperature and the elevated flowing velocity of the pyroclastic currents, it is not possible for these systems to be studied in situ. Therefore, remote analyses are necessary to formulate hypotheses about their evolution, for instance through numerical simulations of the current internal dynamics. Two-dimensional plots reporting the isolines of the logarithm of the pyroclasts concentration at different times as a function of the height and distance from the vent well illustrate those simulations (Fig. 4). The simulations are useful to attain a quantitative description of the currents.
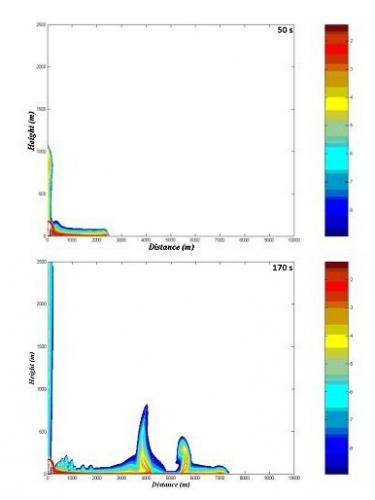
Fig. 4: Snapshots at 50 s and a 170 s of a numerical simulation of the pyroclastic currents
On the basis of the quantitative description of the pyroclastic currents, it has been possible to depict more accurately the distribution of the damages in Pompeii during the 79 AD Vesuvius eruption: they were heavier in the northern areas nearby the volcano and lighter in the southern parts of the town along the sea. The town was completely enveloped by the currents and covered by ashes (small diameter pyroclasts), which choked the inhabitants in such short time that they died quickly by suffocation. The impact with people was so fast that they were not burnt, but were left practically intact.
Bibliography
Branney M., and Kokelaar P.
“Pyroclastic density currents and the sedimentation of ignimbrites”, Geol. Soc.
Mem., 27, 1-14, 2002.
Giacomelli L., e Scandone R. “Vesuvio.
Pompei ed Ercolano. Eruzioni ed escursioni”, BE‑MA, 2001.
Lepore S., and Scarpati C. “New
developments in describing the dynamics of volcanic pyroclastic density
currents through numerical simulations of multiphase flows”, Solid Earth Discuss.,
4, 173‑202, 2012.
Luongo G., Perrotta A., and Scarpati
C. “Impact of 79 AD explosive eruption on Pompeii, I. Relations amongst the
depositional mechanisms of the pyroclastic products, the framework of the
buildings and the associated destructive events”,
J. Volcanol. Geotherm. Res., 126, 201-223, 2003.
Plinio il Giovane, “Eruzione del
Vesuvio e morte di Plinio il Vecchio a Stabiae nel 79 d.C.”, Epistolario,
6, 16, 104 d.C.Valentine G. “Eruption column
physics”, “From Magma to Tephra”, A. Freundt and M. Rosi, Elsevier,
91-137, 1998