We compared data from PISA 2012 Results in Focus with those from Eurostat related to the average yearly expenditure per student from 2005 to 2010, expressed in PPS (purchasing power standard), which is an artificial financial unit, whose value is calculated so that with one PPS it is possible to buy the same good or service in every country (1).
| Country | PISA score 2012 | PISA OECD mean | Spesa per studente (PPS) |
|---|---|---|---|
| Romania | 445 | below | 1970 |
| Bulgaria | 439 | below | 2463 |
| Lithuania | 479 | below | 3196 |
| Latvia | 491 | average | 3511 |
| Poland | 518 | above | 3578 |
| Estonia | 521 | above | 3716 |
| Hungary | 477 | below | 3897 |
| Croatia | 471 | below | 3964 |
| Czech Republic | 499 | average | 4371 |
| Greece | 453 | below | 4479 |
| Portugal | 487 | average | 5044 |
| Ireland | 501 | above | 6023 |
| Italy | 485 | below | 6281 |
| Slovenia | 501 | above | 6327 |
| Spain | 484 | below | 6567 |
| Finland | 519 | above | 6797 |
| France | 495 | average | 6849 |
| Germany | 514 | above | 6976 |
| Belgium | 515 | above | 7371 |
| Japan | 536 | above | 7442 |
| Sweden | 478 | below | 7792 |
| United Kingdom | 494 | average | 7811 |
| Iceland | 493 | average | 7862 |
| Netherlands | 523 | above | 7998 |
| Cyprus | 440 | below | 8000 |
| Austria | 506 | above | 8735 |
| Denmark | 500 | above | 8812 |
| Norway | 489 | average | 9758 |
| United States | 481 | below | 11254 |
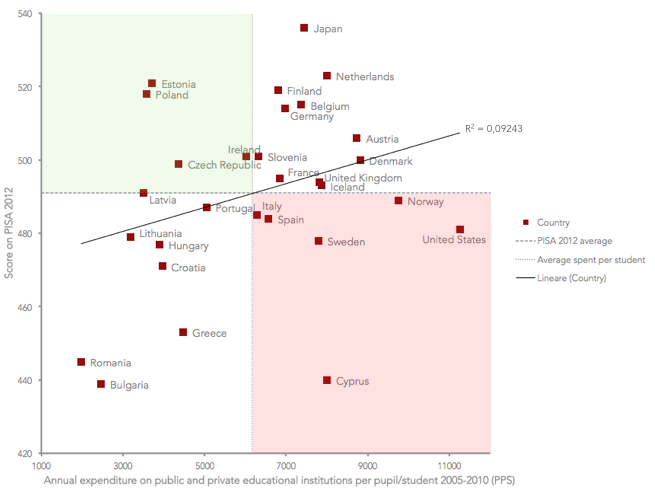
We represented such data with a Cartesian diagram; on the X axis, expenditure data are shown, whilst on the Y axis PISA data are displayed. The graph reveals an expected phenomenon: trend line shows that those countries that spend more also obtain better results.
However, there are also some relevant exceptions. In the green quarter, there are the countries with a below-the-average expenditure but a over-the-average performance - Estonia, Poland, Ireland, Czech Republic - whilst the red quarter displays the opposite situation, that is those countries with higher expenses and lower efficiency. Italy is in this quarter but, surprisingly, there are also Sweden, Norway and United States, all of which spend much more and get lower results than our country, which is quite close to the general averages of both expenditure and performance.
The two outliers, which could consitute, respectively, negative and positive models, are US and Japan. The United States spend more than 11,000 pps, a sum definitely higher than the other countries analyzed but have a PISA score of 490, which is below the average (480). Japan's expenditure, on the contrary, is a bit higher than the average (7442 against 6167) but with a really high PISA score (536). Just behind the Land of the Rising Sun comes the Netherlands, with a score of 523 and an expenditure of 7998 pps.
To sum up, as a general rule spending more means better results, with some exceptions. Also, European northern countries are not always a model. Furthermore, some Eastern European countries developed a system that grant a great efficieny but Japanese stand above all.
1. Data refer to primary, secondary and tertiary schools. Several countries from PISA report are not included in this analysis, because it was not possible to obtain data for their epxenditure per student.